This function generates a radar chart that visualizes the rigor profile for a given applicant's data.
Usage
RRS_radarchart(
  RRS,
  overall_score = FALSE,
  minimal = FALSE,
  show.legend = FALSE,
  show.n_pub = TRUE,
  show.years = TRUE,
  base_size = 14,
  scale = "area"
)
Arguments
- RRS
The output from the
compute_RRSfunction.- overall_score
Show the overall score in the plot?
- minimal
If TRUE, a very simple chart without any legends is drawn
- show.legend
Show the legend to the right?
- show.n_pub
Show the number of publication on which the chart is based?
- show.years
Show a mini histogram to the right with the publication years?
- base_size
Base font size
- scale
Should the sectors be filled in a
"linear"way (i.e., 50% is 50% of the radial height), or to the"area"(i.e., 50% is 50% of the area). Default ="area".
Value
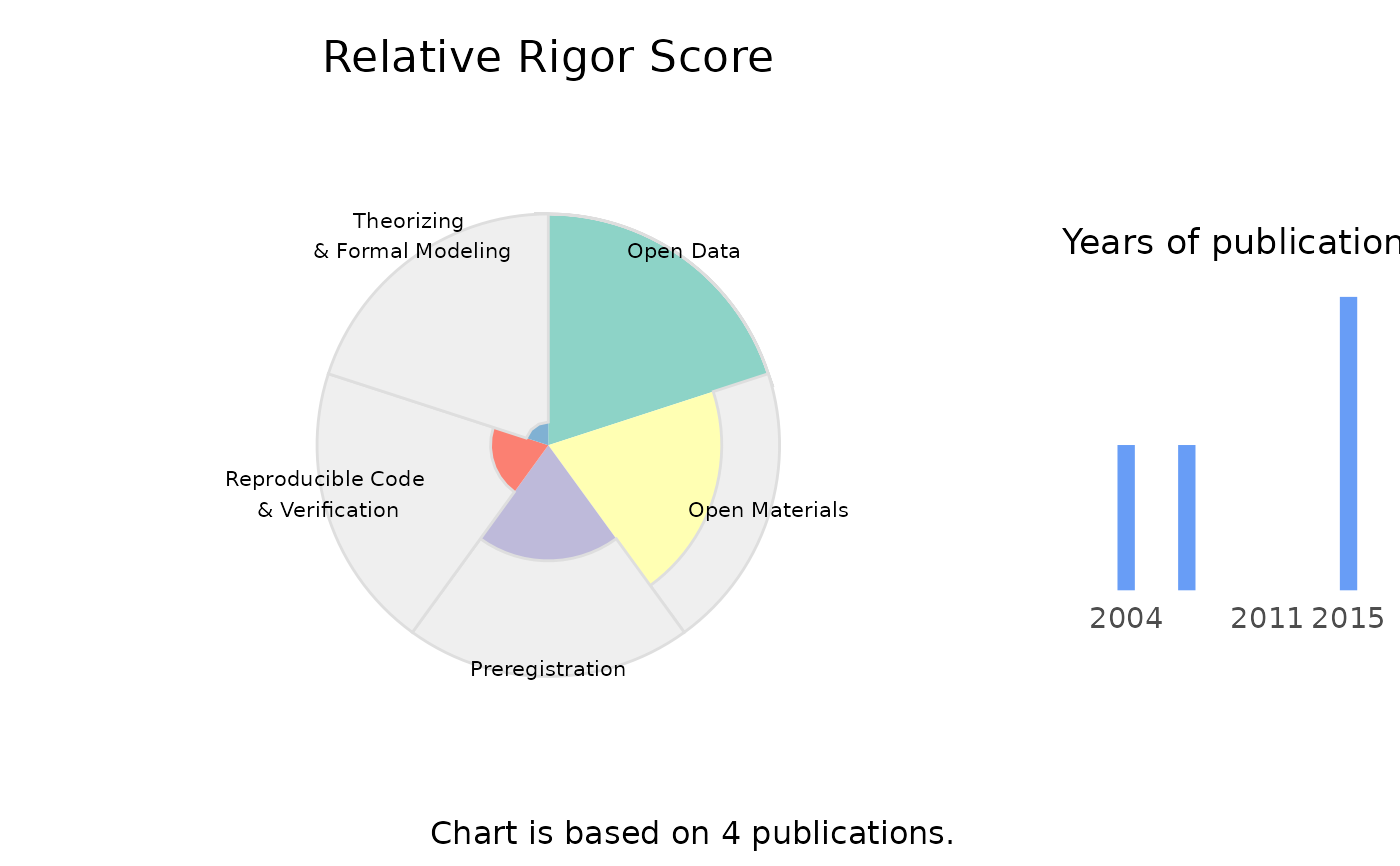
A radar chart visualizing the rigor profile for the applicant, showing the distribution of scores across different dimensions.
Examples
radar_dat <- data.frame(
dimension = c("Open Data", "Open Materials", "Preregistration",
"Reproducible Code & Verification", "Theorizing & Formal Modeling"),
max_points = rep(10, 5),
rel_score=c(1, 0.75, 0.5, 0.25, 0.1),
xstart = 0:4,
xend = 1:5,
xmid=0:4 + 0.5
)
RRS <- list(radar_dat=radar_dat, overall_score=0.5, n_papers=4,
publication_years=c(2004, 2007, 2015, 2015))
RRS_radarchart(RRS)
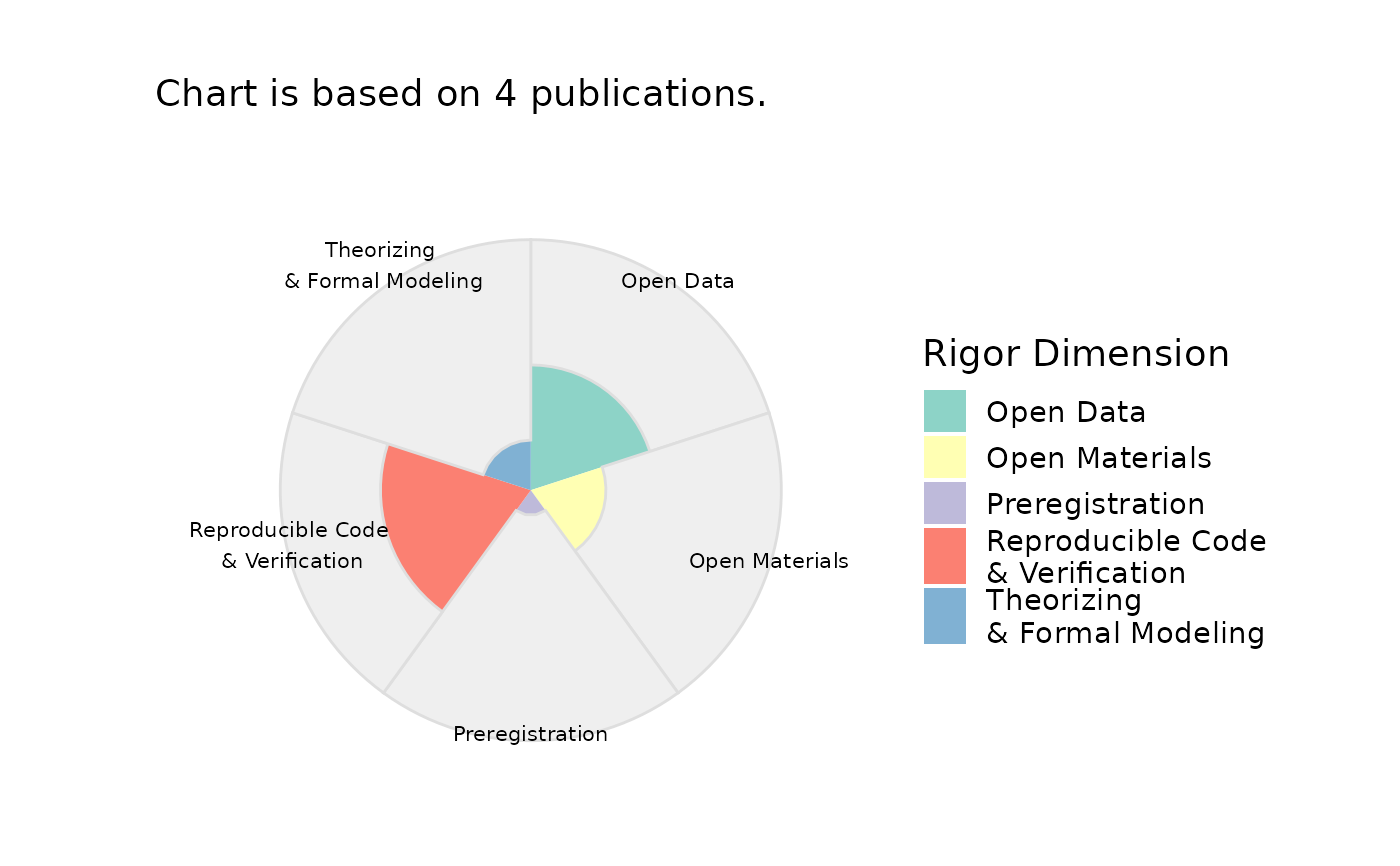 RRS_radarchart(RRS, scale="linear")